How to Calculate Reliability and High Availability in SRE!
We are talking about actual math that we need to put in our code to show case real SRE work!
Zilebox SRE Team
6/21/20234 min read
Are you tired of reading about SRE content that talks about SLI, SLO, and SLA terms, but never really explains how to implement them? Do you want to know how to technically implement high availability and reliability of your supported services/system so that you can customize your own boards according to your requirements? Look no further! In this Zielbox SRE blog post, we’ll dive into the technical details of implementing these concepts and show you how to create custom boards that meet your specific needs.
Today, we are going to talk Math!
We are going to touch on 4 formula’s:
1. Uptime Formula
2. SLO Formula
3. High Availability Formula
4. Reliability Formula
and some hints about how to forward it to time series dB to build Dashboards for your operations team.
Below Formula’s and examples will give you an idea about how to pull/calculate and forward metrics to your time series database so that you can build your SRE boards to take required proactive and reactive actions.
Below Mathematical simple formula’s will help you to build your custom tooling instead of relying on 3rd party solution and you can get this done using combination of
-> Python(Fetch -> Calculate -> Forward) + InfluxDB(TimeSeries DB) + Graphana(Dashboard)
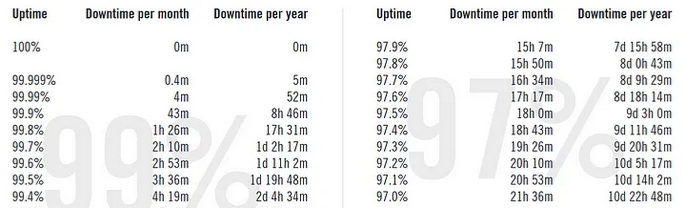
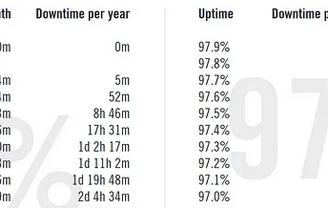
Uptime Formula (Used for SLA)
The uptime formula is a calculation used to determine the availability of a system or service over a given period. It is typically expressed as a percentage and is calculated as follows:
Uptime % = (Total Time - Downtime) / Total Time * 100
where:
- Total Time: The total amount of time the system or service was supposed to be available during the measurement period (usually expressed in hours).
- Downtime: The total amount of time the system or service was unavailable during the measurement period (usually expressed in hours).
For example, if a system was supposed to be available for 720 hours (30 days) during a given month and was down for 12 hours during that period, the uptime formula would be:
Uptime % = (720–12) / 720 * 100 = 97.83%
This means that the system was available for 97.83% of the total time it was supposed to be available during the month.
Note that the uptime formula can be used for any period of time, whether it’s a day, a week, a month, or a year, as long as you have accurate records of the total time and downtime for that period.
2. SLO Calculator
class SLOCalculator:
def init(self, error_budget, time_window):
self.error_budget = error_budget
self.time_window = time_window
def calculate_slo(self, errors):
error_rate = sum(errors) / self.time_window
slo = 1 - (error_rate / self.error_budget)
return slo
3. High Availability(HA) Formula
common formula for measuring HA is the “nines” approach, which is expressed as a percentage of uptime over a given period. The formula can be represented as follows:
HA = (total time - downtime) / total time * 100%
where:
total time is the total time in the period being measured
downtime is the total time during which the service was not available
HA is the calculated high availability percentage
For example, if a service had 5 minutes of downtime during a one-year period (which is equivalent to 525,600 minutes), the high availability can be calculated as follows:
HA = (525600–5) / 525600 * 100% = 99.99905%
This means that the service was available for 99.99905% of the time during the one-year period.
def calculate_ha(total_time, downtime):
ha = (total_time - downtime) / total_time * 100
return ha
4. Reliability Formula
The reliability formula is a calculation used to determine the probability that a system or component will operate without failure for a given period of time. It is typically expressed as a decimal or percentage and is calculated using the following formula:
Reliability = e^(-λt)
where:
- e is the mathematical constant approximately equal to 2.71828.
- λ (lambda) is the failure rate of the system or component, usually expressed in failures per unit time (e.g., failures per hour, failures per year, etc.).
- t is the time period for which the reliability is being calculated, usually expressed in the same units as λ.
For example, if a component has a failure rate of 0.002 failures per hour (λ = 0.002) and you want to know the reliability over a period of 500 hours (t = 500), the reliability formula would be:
Reliability = e^(-0.002*500) = e^(-1) = 0.3679
This means that the probability of the component operating without failure for 500 hours is approximately 36.79%.
Note that the reliability formula assumes that failures occur randomly and independently of each other and that the failure rate remains constant over time. It is also important to note that the reliability formula can be used for any period of time, whether it’s an hour, a day, a week, or a year, as long as you have accurate records of the failure rate for that period.
You can leverage Dashing to build amazing dashboards for your custom metrics using above calculated values. Below you can see we are displaying Oncall person and uptime information calculated through Pager duty incident alerts.
How to forward your custom metric to InfluxDB endpoint(Time-series DB)
from influxdb import InfluxDBClient
# Define InfluxDB connection parameters
host = 'localhost'
port = 8086
username = 'your_username'
password = 'your_password'
database = 'your_database'
# Connect to InfluxDB
client = InfluxDBClient(host, port, username, password, database)
# Define metric parameters
measurement = 'your_measurement'
tags = {'your_tag': 'your_value'}
fields = {'your_field': 'your_value'}
# Create JSON object for the metric
data = [
{
'measurement': measurement,
'tags': tags,
'fields': fields
}
]
# Write the metric to InfluxDB
client.write_points(data)
How to Build Reliability Dashboard of your managed service(Graphana /PowerBI).
You can feed Disaster Probability(Reliability Probability value) to perform actual Reliability calculation on actual data in relation to actual failure and can forward the data to your time series endpoints (InfluxDB).
For an example
import random
import time
import threading
# Define parameters
disaster_prob = 0.3679
recovery_time = 5
monitoring_interval = 1
# Define global variables
failed = False
recovery_start_time = 0
# Define function to simulate system failure and recovery
def simulate_disaster():
global failed
global recovery_start_time
while True:
# Simulate system failure
if random.random() < disaster_prob and not failed:
print("System failure detected!")
failed = True
recovery_start_time = time.time()
# Simulate system recovery
if failed and time.time() - recovery_start_time > recovery_time:
print("System recovered!")
failed = False
time.sleep(0.1)
# Define function to monitor system status and trigger recovery
def monitor_system():
global failed
while True:
# Monitor system status
if not failed:
print("System operating normally.")
# Trigger recovery
else:
print("Triggering disaster recovery...")
time.sleep(3)
print("Disaster recovery complete.")
time.sleep(monitoring_interval)
# Start simulation threads
disaster_thread = threading.Thread(target=simulate_disaster)
monitor_thread = threading.Thread(target=monitor_system)
disaster_thread.start()
monitor_thread.start()
We would love to hear from our readers about their experiences with implementing high availability, reliability, and other technical solutions. Please feel free to share your own tips, best practices, and examples in the comments section or by referencing helpful resources. This will not only help our readers gain more insight into these topics but also create a community where we can learn from each other’s experiences and expertise.
Support Hours
9:00 AM - 5:00 PM IST
All Day.

© 2024 Zielbox Solutions Private Limited | All rights reserved | Terms of Use | Privacy Policy | Sitemap